Scope 3 purchased goods
Emissions avoided by buying reconditioned rather than new, with the methodology footnoted. We will put the figures for your reporting period on letterhead.
This is not a page we added because somebody asked for an ESG section. It is the reason the company exists, and every number on it is published annually — including the bad years.
Manufacturing a new composite IBC releases roughly 262 lb of CO₂e. That emission has already happened for every used container in our yard. Buying one second-hand is the rare environmental decision that also costs you less money.
Across a 500-container fleet decision, choosing reused over new is the difference between 131,000 lb of CO₂e and essentially nothing. That is a larger number than most corporate sustainability programmes move in a year, achieved by a purchasing decision that takes one email.
Most companies in this industry describe themselves as recyclers. We describe ourselves as a reuse company, because the difference between those two words is roughly 117 pounds of CO₂e per container.
Wash, inspect, re-release. 212 lb CO₂e avoided per container versus manufacturing a new one. 58% of our 2025 throughput.
Reuse the cage and pallet — 60% of the container by weight. 162 lb avoided. 21% of throughput.
Rain harvesters, planters, aquaponics, lockers. Containers that will never carry product get another decade. 6% of throughput.
HDPE to regrind, cages baled to regional mills, pallets recovered. 12% of throughput, and our least favourite number on this page.
| Outcome | Share of 2025 intake | CO₂e avoided per unit | Why not higher up the ladder |
|---|---|---|---|
| Reuse as-is | 58% | 212 lb | — |
| Rebottle | 21% | 162 lb | Bottle crazed, split or chemically spent |
| Repurpose | 6% | 212 lb | Undocumented history or solvent exposure |
| Recycle | 12% | 95 lb | Structural failure or contamination |
| Licensed disposal | 3% | n/a | Regulated residue, gasket rubber, wash sludge |
| Landfill, whole containers | 0% | n/a | We have never done this and will not start |
Washing a container the obvious way takes sixty gallons of fresh water. Do that four thousand times a year and your environmental story quietly collapses.
Our wash bay drains to a 6,000-gallon recovery sump, through an oil-water separator, settling, bag filtration to 25 micron and cartridge filtration to 5. Filtered water goes back to pre-rinse and detergent duty; only the final rinse uses fresh potable water. Net fresh water consumption is about four gallons per container rather than sixty.
The impact calculator takes your quantity, container type and chosen path and returns figures you can drop into a report, with the equivalences spelled out.
Every figure on this site is counted the same way, and the way you count decides the answer. This is the whole method in one place so you can check it or argue with it.
| Figure | What it counts | What it excludes | Basis |
|---|---|---|---|
| Diversion rate | Containers that physically left the yard, by mass | Stock held in inventory | Internal weights and counts |
| CO₂e avoided | Embodied emissions of a new container not manufactured | Your freight, your product, downstream life | Published resin and steel factors, our own energy use |
| Water saved | Open-loop wash versus our recovery loop | Your own site water | Metered make-up versus measured cycle volume |
| HDPE kept in service | Bottle mass returned to use or to regrind | Hardware and gaskets | Measured granulator feed average |
| Landfill avoided | Full container mass less unrecoverable hardware | Residual consumables | Internal weights |
Emissions avoided by buying reconditioned rather than new, with the methodology footnoted. We will put the figures for your reporting period on letterhead.
Per-load diversion statements with counts by grade, destination path per stream and landfill avoided by mass. Several municipal customers aggregate these annually.
Public and institutional buyers cite our published grade standard and diversion methodology directly in bid documents. That is a legitimate use and we encourage it.
The cost comparison plus the avoided emissions is usually enough to get a pooling programme or a reconditioning contract approved internally.
Yes, for your reporting period, with the methodology attached and the limitations stated. Put 'impact statement' in the message field with your quantities and container types.
No. We publish our own standard with dated commitments and we host audits, which is a different thing and we will not dress it up as certification.
Ask for the audit packet: wash bay cycle logs, granulator feed weights, outbound regrind sales, steel bale tickets from the receiving mill, and the diversion worksheet for any quarter you choose.
Most likely because we count containers that left the yard rather than containers we received. Counting intake flatters the number by whatever is sitting in stock, which on a 3,000-container inventory is not trivial.
Choosing reconditioned over new. Roughly 212 lb of CO₂e per container, which across a 500-container decision is 106,000 lb — more than most corporate sustainability programmes move in a year, achieved with one email.
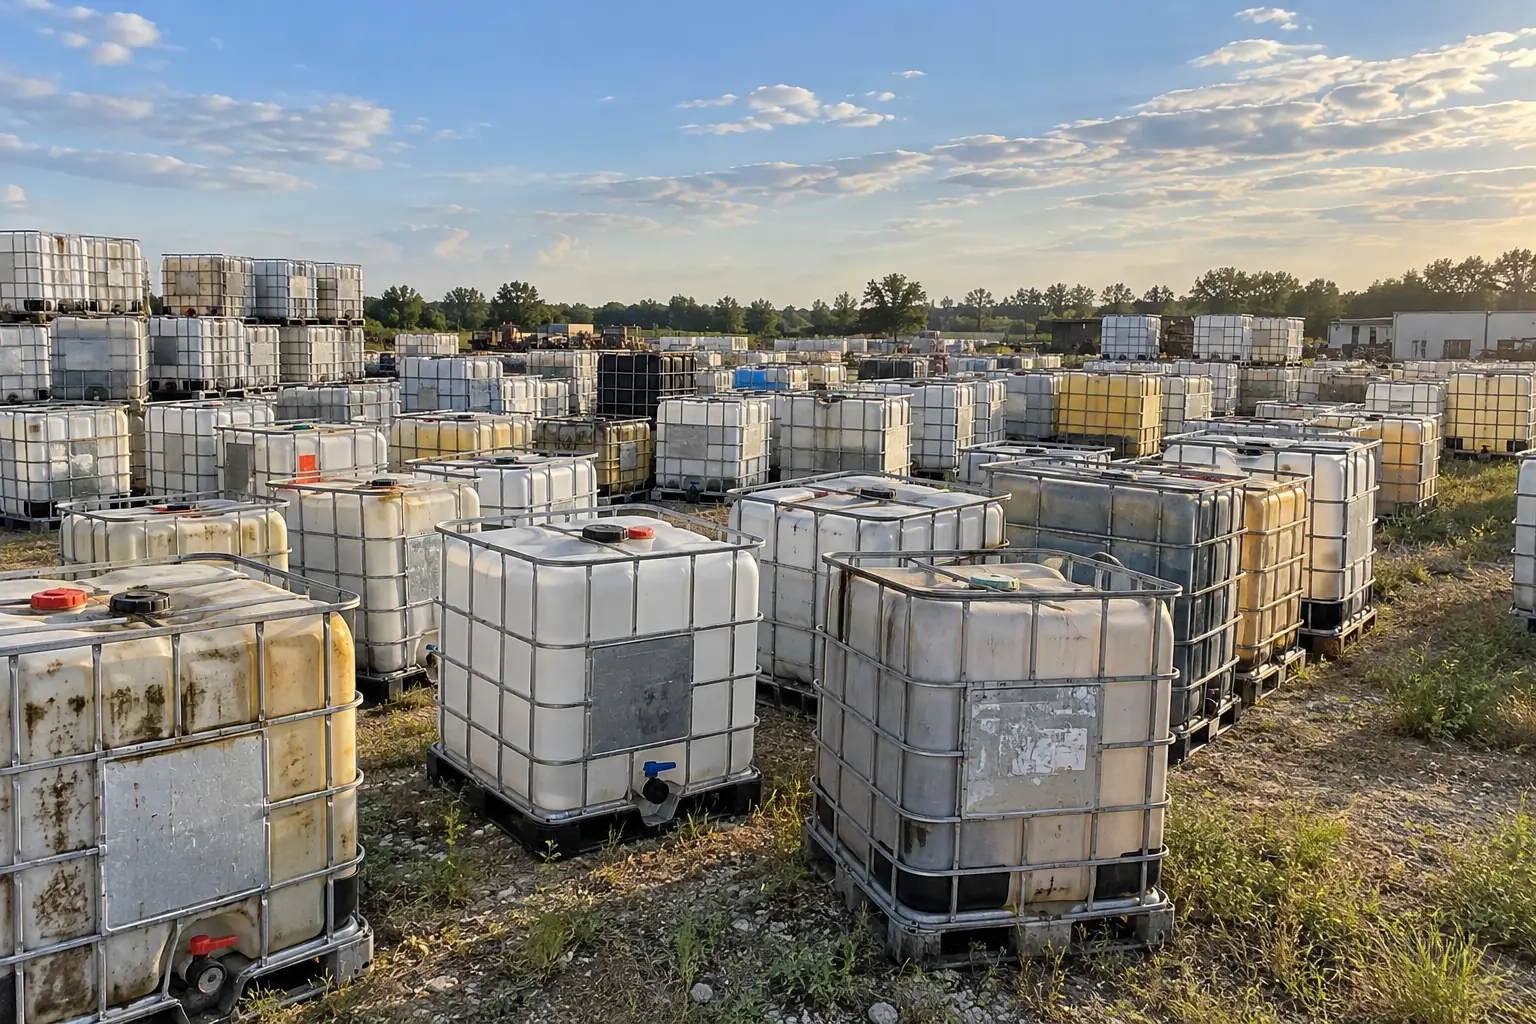
Stained, weathered, labels half attached, histories nobody wrote down. Judged on appearance alone most of this looks like waste, and the entire argument of this company is that it is not: 79% of what comes through the gate leaves reused or rebuilt, 12% is granulated into regrind, and none of it is landfilled whole.
A fifth of everything we grind was destroyed by missing paperwork rather than by chemistry or wear. A written last-contents declaration costs nothing and is the difference between a $50 asset and a bag of pellet.